Idea Overview:
Occasionally when the stars align Mr. Market presents us with a phenomenal long-term investment opportunity. I believe a long position in the shares of JD.com (“JD”) offer such an opportunity for investors to compound their capital at exceptional risk-adjusted rates of return over the next 5 – 10 years (or potentially decades into the future).
JD is China’s largest online direct-sales company and trades at 2.4 – 2.8x 2020E EBIT and maintenance FCF respectively. The company has a great “flywheel” business model,[1] and benefits from several powerful secular tailwinds, which will help sustain a massive open-ended growth runway. Equally as important, the company is controlled and managed by a phenomenal CEO who is an extremely competent operator and has a great track record of growing shareholder value per share while prioritizing the interests of minority shareholders.
I believe JD shares are easily worth multiples of the current stock price under any reasonable, conservative scenario, and even under a draconian scenario I see the shares compounding at 20 – 25% annually over the next 5 – 7 years. In the most likely future outcome, I believe JD’s intrinsic value per share can reach $140 – $180 by 2020, which would yield a MoM of 5.7x – 7.4x over the next 5 years, or a 40 – 50% annually compounded internal rate of return.
Key Value Drivers in Thesis:
- JD’s competitive advantages are strengthening over time; core operating margins are on the verge of a multi-year inflection as Gross Merchandise Value (“GMV”) continues to grow at a market-leading rate.
Partly due to ongoing current investments into fast-growing, emerging businesses that have been internally incubated (JD Finance and JD Home/Daojia), JD has yet to report positive GAAP operating profits. These segments are currently loss-making and have masked a steadily improving margin profile for the core JD e-commerce business, which should expand its gross margins closer to 20%+ and operating margins as a % of net[2] GMV closer to mid-single digits over the next 5 – 7 years.
The key drivers behind this inflection are: 1) a direct-sales product mix-shift away from relatively low-margin electronic products to higher gross margin categories such as home appliances and general merchandise[3], along with higher mark-ups, 2) the growth of contribution profits from third-party marketplace businesses such as commissions, advertisements[4] and logistics & warehousing services, which are all very high-margin or are under-monetized services, and 3) greater scale economies. Specifically, rapidly growing first-party unit volumes will increase bargaining power for procuring merchandise from suppliers, and a steadily incremental increase in order density in under-penetrated cities will lower JD’s average fulfillment cost per order over time.
- JD Finance’s value is massively under-appreciated by investors.
JD owns 85% of JD Finance which serves as an internet-based lender and payments processor to suppliers/wholesalers, 3P merchants, and customers within JD’s e-commerce ecosystem[5]; other ancillary services include crowdfunding, insurance and wealth management.
This unit will become entirely self-funded for the remainder of this year and benefits from leveraging the rapid growth and transaction data of JD’s core e-commerce business within a closed-loop ecosystem. JD Finance may potentially IPO in the Chinese A-share market sometime in the early 2017 timeframe, which would create a clear catalyst to unlocking its under-appreciated value. An IPO or spin-off will also remove its reported losses off of the core e-commerce business PnL.
A private funding round led by Sequoia in January valued this business at around $7.2bn, or ~25x 2015 sales. If valued at 5x 2020E sales post-dilution, JD Finance could be worth closer to $12.3bn to JD equity holders five years from now, and would make up more than ~40% of JD’s entire enterprise value today.
- JD is led by one of the world’s best CEOs. Richard Liu is very shareholder friendly, has extremely high integrity, and has created one of the most well-managed and successful e-commerce companies today.
The quality of the people managing the business and their ability to intelligently allocate capital cannot be understated in a long-term compounder thesis. Up to this point, Richard has largely been correct on all the major strategic decisions for the business, and has executed near flawlessly towards becoming the dominant e-commerce franchise in China long-term. I believe his interests are well aligned with minority shareholders, and that he is working to maximize shareholder value for all investors.
Why does this opportunity exist?
- The market’s failure to accurately price in JD’s earnings power on a longer-term time horizon has created a massive opportunity for fundamental investors willing to make a longer-duration investment. Namely, the scalability of JD’s business model is under-appreciated as FCF generation is back-ended; 5 – 7 years from now, margins are likely to be substantially higher as normalized earnings power continues to ramp-up materially. The fact that JD currently reports no positive earnings makes the idea optically unattractive to potential investors.
The Street in particular appears myopically focused on the next few quarters’ revenue prints and near-term margin implications, at the expense of developing a well-informed longer-term outlook. They are also focused on the wrong metrics such as total revenues and reported EBIT. Given the nature of JD’s business (1P + 3P platform), net GMV, normalized operating profit and earnings power are the more relevant valuation metrics.
- Investors appear overly concerned about the credit quality of JD Finance’s lending business. In reality, management is prioritizing risk management over short-term profitability for this division. Current losses and the unfavorable working capital dynamics to the core e-commerce business have also contributed to near-term investor worries. Public disclosure of key metrics has been very limited, but I believe risk here has been over-priced.
- General macro concerns over the health of China’s economy have depressed valuations across all sectors of companies operating in China. Chinese equity ADRs listed on US exchanges, in particular, appear unloved by Western-based investors and currently trade at large discounts. In reality, there is a large disconnect between China’s consumption vs investment spending, with the former expected to steadily increase over time, and greatly benefit businesses leveraged to consumer spending such as JD.
Core E-commerce Business Model and Competitive Advantage:
JD’s core e-commerce business can be divided into 2 segments: the direct-sales platform and third-party marketplace.
First-Party (“1P”) or Direct Sales Platform:
JD operates the largest online direct-sales platform in China (~$39.5bn reported GMV FY2015), enabling the company to achieve superior economies of scale in product procurement and turnover its inventory at a faster rate than any other national competitor. The business is run incredibly efficiently given its size; at an average inventory days of 32-33[6], inventory turnover is amongst the lowest of global and local peers such as Amazon, Walmart, Suning and GOME, despite its direct-sales GMV being a fraction of Amazon and Walmart’s GMV, respectively.
JD’s 1P business makes up ~57% of total company GMV. Electronics and home appliances are the largest product categories at 80% of the total 1P GMV mix, with the “general merchandise” category making up the remainder. Electronic products currently sell at mid-single digit gross margins, home appliances are at around high-single to low-double digits, and products within general merchandise have margins around mid-teens.
Third-Party (“3P”) Marketplace Platform:
JD’s online marketplace (~$29.5bn reported GMV FY2015) was launched in October 2010 and has already grown to ~43% of JD’s total company GMV. Similar to Amazon’s third-party marketplace business, there is a network effect at play here as more merchants attract more customers in a positive feedback loop. Third-party merchants are vetted very carefully to ensure product authenticity and must be able to meet JD’s demands for a timely supply of authentic products and also provide high-quality post-sales customer service.[7] Despite the careful vetting process, the business has been growing rapidly at an average rate of nearly 200% per annum over the past 4 years.
Why is JD’s Competitive Advantage Durable?
“The company that wins the customer’s mindshare, the company wins the ecommerce war.”
– Richard Liu, JD.com Founder & CEO
The source of JD’s competitive advantage is its end-to-end nationwide fulfillment network which allows the company to provide a high-quality, consistent and speedy delivery service at large scale; this strengthens customer loyalty/mindshare over time and increases economies of scale within a positive feedback loop; this in turn allows the company to price a wide selection of authentic products competitively and incrementally take market share within a largely 2-player B2C market with Tmall, creating a high barrier to entry to potential online shopping platforms.
“We believe that JD’s self-owned logistic network has become our core competitive advantage that consumers have come to trust.”
– Richard Liu, JD.com Founder & CEO
The nature of China’s e-commerce industry is different from that of western developed markets. Mainly, two stark realities that e-commerce companies have to address in China are unreliable, low-quality[8] third-party courier services and the ubiquity of counterfeit products[9]. JD has tackled both issues with great success to date by adhering to a stringent process of selling only authentic products on its platform and taking an asset-heavy approach to investing in its own in-house logistics network.[10]
This strategy is differentiated from Alibaba’s predominately asset-light approach[11] to last-mile delivery, but has allowed JD to build considerable brand equity over time with customers. In essence, the trust that JD has built with its customer base with respect to authentic products is a major intangible asset[12], along with the substantial scale benefits of owning the largest in-house logistics network out of all competitors.
“The majority of JD’s customers has shopped on other platforms before but was tired of having to be on alert for fakes all the time. So they came to JD even though our prices may be a little higher than the other places.”
– Richard Liu, JD.com Founder & CEO
Key Pillars of Successful E-Commerce Platforms: Tmall & Taobao vs JD
Conventional analysis of e-commerce business models suggests that the key drivers to success are low prices, high-quality customer service and a wide selection of products. My research suggests that all three factors are important in the China market, but not equally so.
Based on surveys I’ve conducted on online shoppers in China and along with supporting research from proprietary, third-party studies[13], product authenticity is by far the most important factor for millennial and higher-income shoppers when deciding which e-tailer platform to stick with. The results of my own proprietary survey suggests that online shoppers rate delivery service and product authenticity highest on JD.com, whereas selection and to a lesser extent, competitive prices, are rated more highly on Alibaba’s major e-commerce platforms Tmall and Taobao.
Please see Appendix 1 for further details and the results of my survey.
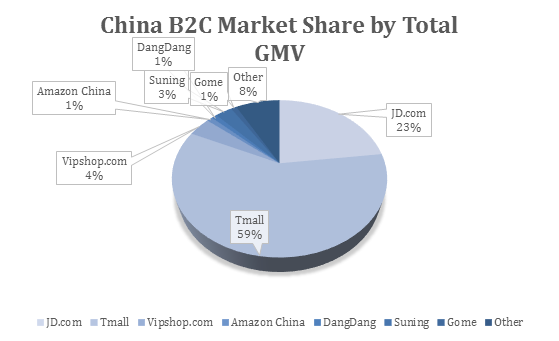
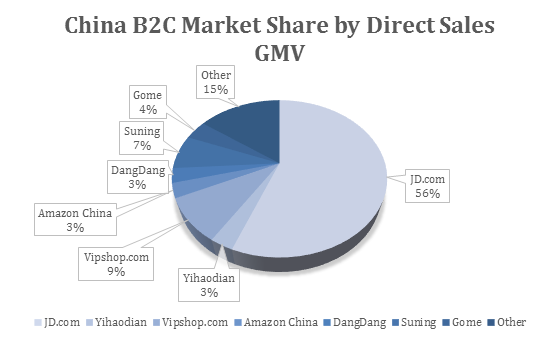
The results of these consumer studies provide insights into how JD has managed to steadily grow its B2C market share – when measured in total transaction volume (GMV) – from ~17% in 2012 to ~22% in Q3 2015, according to iResearch. The major demographic groups that represent JD’s core customer base are technologically savvy millennials and higher-income shoppers, mainly between the ages of 20 – 45. These shoppers tend to be very sensitive to the speed of delivery, less price-sensitive and care greatly about product authenticity. Shipping speed in particular is very important in a market such as China, where customer behavior has already been modified to expect free and speedy shipping when shopping online.[14]
“The real Internet population is people born after 1985. January 2000 was the real beginning of China’s Internet. None of the key Internet players were really born before that. There were only about 4 to 5 million Internet users in China then, while there were 130 million in the United States. The people born between 1980 and 1985 had already completed their education in college by 2000. They mostly started using the Internet in a working environment.”
– David Wei, Founding Partner & Chairman, Vision Knight Capital
Price and product selection are still very relevant, especially in the online shopping world where search costs are very low, which is why I believe a platform such as Tmall will continue to do well and grow along with the B2C market for the foreseeable future. Tmall is Alibaba’s B2C marketplace platform (~$176bn annual reported GMV LTM). Combined, Tmall and JD have a 82% share of China’s B2C market, and both continue to take higher incremental share at a fast clip.
“I think low price is something a customer always wants and there is always the philosophy that either you want to offer customers the best price or you want to play smart. For traditional companies or offline companies, the information is not transparent: one location is different from another and hence it is hard for customers to compare, so may be they can do things differently. But for online businesses, people easily check up your prices, compare them and even complain about them. We receive a lot of such complaints every day. We will keep a low price policy forever.”
– Shi Tao, Vice President & GM of Global Business, JD.com
Taobao is the other major Alibaba marketplace platform that relies on low prices and a wide product selection as key selling points. Despite the size of Taobao (~$280bn annual reported GMV LTM), annual GMV growth has slowed considerably (~20% over the LTM). Given Taobao’s C2C business model and Alibaba’s limited ability to enforce product authenticity over sellers, fake products have proliferated over the platform.[15] Moreover, due to a lack of control over third-party merchants, return policies on Taobao are typically not as customer friendly as JD’s guaranteed 7-day, free return policy.
“If you need to return the goods to a Taobao seller, once the money is released, it can become quite a challenging experience. You never know how fast it will ship and whether the product is still in stock.”
– Toine Rooijmans, Cofounder, Dining City
Alibaba’s answer to Taobao’s reputation for fake products was the creation of Tmall. Tmall was spun out of Taobao in 2010 with the premise of guaranteeing authentic products. Although not completely devoid of fake products like JD[16], Tmall has been growing impressively with an annual reported GMV growth of ~50% over the LTM. Tmall has also been cannibalizing Taobao’s business, and given Taobao’s issues, I fully expect their business to continue to slow, and potentially start entering into secular decline over the next several years as transaction volume continues to shift from C2C to B2C.
In my view the question that can summarize the entire “JD.com vs. Alibaba”[17] investor debate is this: If there are primarily two dominant existing businesses/platforms operating within an open-ended, secular growth industry, and together they will take the lion share of future growth in a de facto “winner-take-all” outcome, would you rather be invested in the business that will very likely generate more value per unit of incremental growth over time in an exponential-like trajectory, or the business which currently has a more attractive and stable financial profile, yet will likely have a lower rate of return on incremental invested capital than the former?[18]
Leaving valuation considerations aside, I think the answer for long-term fundamental investors is very clear: JD.com is the better bet.
Major Direct-Sales Competitors
Globally, the business model of brick-and-mortar retailing across broad product categories is melting away, with the internet and the convenience of online shopping as the main catalysts. This phenomenon is even starker in a developing market such as China, where the lack of a sophisticated offline supply chain network and high rental rates have advantaged online platforms greatly and allowed them to reach critical mass to the detriment of offline retailers.[19] Due to the massive lead of platforms such as Tmall/Taobao and JD, China will likely experience structurally higher e-commerce penetration levels than developed markets.[20]
JD’s direct-sales business is already substantially larger than any direct competitor, including any third-party merchant on JD, Tmall or Taobao’s platform. As a 1P retailer, JD’s scale advantage in product procurement from suppliers allows the company to implement higher mark-ups or price lower than competitors, which drives higher volumes and thus higher cost efficiencies in the supply chain. This successful playbook is nearly identical to the one Walmart used to become the world’s largest retailer.
Given JD’s massive share lead, I believe the “game” is already over for all of JD’s direct-sales competitors, whether offline or online, with the possible exception of Vipshop.com and a few other niche vertical players.
Suning and GOME are the closest direct offline competitors to JD, as selling home appliances and electronics make up the majority of their sales mix. Despite being the largest offline retailers (excl. groceries) in China, they have been pressured by online competitors such as Tmall and JD to restructure their businesses[21]. Offline pricing integrity has suffered greatly as Suning, for example, has adopted a same-price policy for online and offline stores. The most relevant comparable to Suning and GOME is Best Buy, which has been in a death spiral of continually being pressured to consolidate its store base with a less efficient cost structure and compete against Amazon.
Amazon entered China in 2004 but despite an initial market share advantage, has yet to gain any real traction (Amazon China at its peak owned 20% of the B2C market and has since shrunk to less than 1%). I believe Amazon has largely failed in China because all of the key decision-making was deferred to HQ overseas, instead of empowering the local managers on the ground; this led to inefficient decision-making processes and an inability to respond agilely to the fast-evolving challenges and demands of the local Chinese market.
“Global companies tend to push one-size fits all solutions while to succeed in China you need to localize your strategy.”
– Krzysztof Werkun, Partner, China Renaissance Partners
“They (Amazon) rely heavily on the system, the technology. But their policies, local strategies, and local marketing are kind of not flexible enough. That’s why they are behind us in China. We make a very quick decision based on the market challenge. But I don’t think Amazon is doing that. What Amazon does in China is follow its global model and global process. If they apply the model in Germany, France or Japan, they also do it in China. They don’t consider if there are specific challenges and customer needs. That’s the difference between us and Amazon.”
– Shi Tao, Vice President & GM of Global Business, JD.com
Another one of the smaller B2C competitors, Vipshop.com can be thought of as the online version of TJX. It is a flash sales website that adheres to an off-price, off-season retailing model with apparel as the major category. In essence this business occupies a niche within Chinese online shopping by targeting a certain customer demographic that primarily shops on mobile and buys on impulse.
I don’t have a strong opinion on the future success of this business, but search costs online are lower than offline retailing; a price comparison between websites is quick and convenient. This appears less of an issue for TJX where their core customer demographic are middle-aged, higher-income women who are typically in the habit of going to a TJX store and expecting discounted branded goods.[22] Given that both JD and Alibaba have fast-growing flash sales sites, along with JD’s low-cost advantage in fulfillment and having a substantial overlap in customer bases with Vipshop, Vipshop’s already narrow moat could erode further longer-term. JD’s flash sales site in particular has been growing rapidly at 200-300% per annum and will continue to be a focus for the company as they continue to expand aggressively into apparel.
Beginning of the End of Major Pricing Wars
As mentioned above, JD’s retail competitors are at a major competitive disadvantage.
On its path to success, there have been several multi-year price wars where JD has largely crushed its rivals such as Newegg (private), Amazon China, and Dangdang.com. With the three and a half year old pricing war against Suning and GOME centered on home appliances and electronics[23] potentially drawing to a close near-term, I believe we are near the beginning of a multi-year runway for JD to steadily price major categories at higher mark-ups relative to competitors, creating additional room for 1P gross margins to inflect upwards.
I’ve compared prices across several popular electronic and home appliance items on JD.com’s and Suning’s online websites.
Please see Appendix 2 for the price comparison results.
The results of this project suggest that, for the moment, average prices for JD and Suning are listed within a narrow band. However, for the JD buyer, in addition to benefiting from competitive prices, the buyer gets a faster and more reliable delivery service, best-in-class customer and post-sales service[24], and an option to conveniently return items for no incremental fees.
“There are two kinds of companies – those that work to raise prices and those that work to lower them.”
– Jeff Bezos, needs no introduction
Suning generated total sales of ~Rmb135.5bn during 2015, and GOME is a smaller business than Suning. For reference, JD reported net direct-sales of ~Rmb134.3bn for 2015 for its electronics and home appliances category, but this revenue stream alone will likely grow 3x-4x faster than either Suning or GOME’s entire business over the next several years. Having less efficient cost structures, Suning and GOME have seen their operating profit margins erode significantly over the past few years and have little to no more room going forward to sustain a major price war with JD.
Even if Suning and GOME decide to irrationally price at 0 to negative gross margins, they are doomed to fail. Advantaged with its greater scale to squeeze lower prices via larger volume rebates from suppliers, JD can easily afford to continuously match or even price slightly above Suning or GOME’s listed prices and still achieve higher relative mark-ups and thus higher product margins.[25]
Category Mix-Shift
An additional leg to my overall 1P gross margin expansion thesis is that JD is quickly diversifying its product sales mix away from low-margin electronic items; general merchandise gross margins are 2 – 2.5x higher than electronics and home appliances, but are likely growing twice as fast, leading to sizable overall gross margin expansion.[26]
Richard Liu has made it a priority to be the number one direct vender of home appliances by the end of this year, and to be a market leader in apparel within 3 years. Part of the strategy is to shift more apparels out of the third-party marketplace into direct-sales as JD believes it can achieve incrementally more scale efficiencies than third-party merchants selling these products directly over time.[27] Apparels are also among the highest gross margin category in all of e-commerce. Given JD’s additional advantage in being able to leverage its scalable logistics network over higher levels of SKUs/volume, this strategy appears sensible.
Currently, JD’s 1P business is earning 6-7% gross margins, and assuming general merchandise products grow to 40% of the total 1P mix vs 20% today, along with higher mark-ups, 1P gross margins can potentially expand closer to low-double digits, or by more than 500bps by 2020.[28]

2015 – 2020 Total 1P Gross Profit Bridge:
In my most likely scenario, I model JD’s direct-sales business to grow at a ~31% CAGR over the next 5 years. I will discuss my forward growth projections in greater detail in the valuation section, but for reference, this business has grown at a ~71% CAGR over the past 4 years. Under this scenario, overall 1P gross margins expand by a total 300 – 400bps over the next 5 years, contributing ~52% of the delta to the 2015 – 2020 1P gross profit bridge. Product category mix-shift and volumes account for the rest of the delta (~48%) in total gross profits.
Critical Mass, Pricing Power, and Completing the Flywheel
As previously mentioned, Tmall and JD combined control ~82% of China’s B2C market. Given that both platforms have already achieved a critical mass of merchants/suppliers and market share, both platforms should be able to continue to grow their respective market share well into the future.
Despite Tmall’s advantage in product selection and its competitive prices, neither vendor may ever satisfy the needs of all consumers. However, I believe JD has the greater potential to grow its incremental customer share at a higher rate than Tmall.
How I think about this issue is this: A company’s reputation, brand and mindshare with consumers are relatively difficult to change over time. Consumer shopping habits are typically very hard to change. JD has already demonstrated that it places the customer first primarily by selling only authentic products and offering the highest-quality delivery service in the industry, and this advantage is not easily replicable.
If selection and to a lesser extent, competitive prices, are the two areas where JD has the most room for further improvement, then JD has massive potential to grow beyond its core customer base. These variables, in my view, are “low-hanging fruit”, compared to the time and investment needed to build a superior customer service and trust.[29]
As mentioned, search costs in online retailing are generally lower than in offline. A shopper can easily compare prices and product selection across multiple shopping sites quickly. As JD continues to leverage its flywheel to expand into under-penetrated categories such as apparel, baby, cosmetics, and groceries, and grow its third-party marketplace, its platform becomes more attractive to buyers.
As its scale in procurement grows faster than any other vender, JD’s pricing power will only get stronger over time. And there are already signs that this is happening.
1) Delivery the product to the end customer is an integral piece of the e-commerce value proposition. Steady raises in the minimum order value threshold for free delivery are de facto hidden price increases, which has been a recurring practice for JD over the years. In fact, JD recently increased its minimum order size from Rmb68 to Rmb99 for free delivery.[30]
“We’ve raised the minimum purchase amount that qualifies for free delivery in each of the past three years. We started with zero – even if you bought something for five yuan, we delivered for free. Then we raise the amount to 29 yuan ($4.64), 59 yuan and then 79 yuan this year. Next year we’ll raise it to 99 yuan. We may charge for all deliveries in 2017.”
– Richard Liu, JD.com Founder & CEO
This is brilliant as it naturally forces consumers to lump their purchases into larger orders (leading to higher average GMV per order/average transaction values, all else equal) and also potentially reduces order splitting. In the future, price discrimination via offering different shipping speeds is also a possibility. JD is also currently experimenting with an Amazon-like Prime membership service with a small group of consumers, which could help further increase customer stickiness.
2) Prices for third-party marketplace-related services are increasing. The annual service fee for a 3P merchant doubled from Rmb6,000 in 2014 to Rmb12,000 in 2015. Take rates for certain categories such as jewellery have also increased.[31] JD already charges higher take-rates of between 2 – 10% relative to Tmall at between 0.5 – 5%.
As JD’s active customer base grows over time (currently at 155mm), merchants will become more captive to JD’s platform. Most merchants would be incentivized to have a presence on both Tmall and JD to maximize their sales, leaving JD room to increase take-rates.
3) Finally, certain product categories such as baby and fresh groceries/food have stronger inelastic demand profiles on JD’s trusted platform, and thus sell at premiums. These categories are particularly health-sensitive to Chinese consumers; in consequence, consumers are willing to pay a premium for these products on JD.com for the perceived safety and peace of mind.[32]
I think JD’s flywheel is already complete: despite relatively higher prices than competitors, JD continues to grow its GMV (both 1P and 3P) at the highest rate.
Core E-Commerce 2015 – 2020 Blended Gross Profit Bridge:
Over time, steady growth in penetration rates and prices across value-added services such as advertising, cloud-based software & data analytics, marketplace commissions & fees, and warehousing & delivery[33] is likely as JD’s closed-loop ecosystem becomes more attractive to suppliers and third-party merchants. JD’s 3P monetization rate is currently 10.5% as a percentage of net 3P GMV; I think their 3P take-rate/monetization rate can expand closer to 14%, or by 350 bps, by 2020.
JD currently delivers ~25% of its 3P parcel volume, and sorts a single-digit percentage point of 3P parcels in its warehouses. The 3P warehousing service is relatively new – introduced only recently in mid-2015 – hence the current low penetration rate. According to IR, JD’s penetration of third-party last-mile delivery services hasn’t meaningfully ticked higher because JD would incur too large of a loss to deliver merchandise for many of the lower volume 3P merchants on its platform.[34] However, as JD grows its warehousing capacity, penetration rates across both 3P warehousing and delivery services should increase.
With the exception of the warehousing & delivery services[35], the 3P services are all very high-margin revenue streams, (likely 100% gross margin excluding any traffic acquisition costs) and are among the fastest growing service lines on JD’s platform.
I am modeling core e-commerce blended gross margins to expand to the low 20’s percent range by 2020 from 13.4% in 2015, with 1P gross profits and 3P gross profits driving ~47% and ~53% of the total change, respectively.[36] The improvement in overall gross margins should fall straight to the bottom line.
Unit Economics of JD’s Logistics Business
“Distribution and transportation have been so successful at Wal-Mart because senior management views this part of the company as a competitive advantage, not as some afterthought or necessary evil. And they support it with capital investment. A lot of companies don’t want to spend any money on distribution unless they have to. Ours spends because we continually demonstrate that it lowers our costs. This is a very important strategic point in understanding Wal-Mart.”
– Joe Hardin, Former Walmart executive vice president, logistics and personnel
Unit-Economics
The cost structure of a fully-integrated logistics business can be broken down into three main parts: Fulfillment Center[37] (“FC”), Line-haul transport (“LHT”), and Last-mile delivery. Last-mile delivery constitutes ~50% of the total cost per parcel/order, and line-haul makes up ~37%.[38]
Since JD is currently pricing its 3P delivery service around marginal cost, I think it would be instructional to compare JD’s average delivery cost per order vs. industry ASPs. JD’s total fulfillment cost per order was ~$1.70 in 2015, the lowest amongst all major B2C platforms in China.[39] Shipping cost (or last-mile delivery cost) per order was half of this, at $0.85.[40] Industry ASPs for 3rd party couriers are currently around Rmb10 per parcel, or $1.50. Note that this service doesn’t include storing inventory for the merchant, and last-mile courier firms are currently already earning very thin margins.
Conservatively, JD’s current net GMV per 1P order is around $21. Out of that $21 they make an average 6 – 7% gross margin, or ~$1.40 per order. Contribution losses per order are around $0.30 if we fully expense fulfillment costs.[41] By 2020 I think JD’s fulfillment and shipping cost per parcel can easily get below $1.50 and $0.75 respectively, driven by robust parcel volume growth and increasing order density in lower-tier cities. In consequence, by 2020 JD should easily be profitable on a contribution profit basis[42] as 1P gross margins expand, and should also be able to earn a positive contribution margin on third-party delivery and warehousing services.
For more details on my fulfillment unit economics assumptions, please see my model in Appendix 6.
So despite owning its logistics assets in-house, JD’s cost structure is already very competitive vs. third-party couriers (who typically have a lower-quality service), and the company is well-positioned to leverage more cost efficiencies over higher levels of parcel volumes over time. Morgan Stanley estimates that China’s total express delivery parcel volume will reach ~48mm in 2020 from ~19mm in 2015. JD will likely expand its volume share of this market from 6.5% in 2015 to 13% in 2020.
Brief Overview of 3PL Operators with Franchise Models
China’s logistics industry remains highly fragmented and inefficient[43]; it is unlike the oligopolistic competitive structure that exists in the US, where UPS and FedEx ensure a consistent and timely delivery service with nationwide coverage.
The largest 5 – 6 private express delivery operators in China primarily use the franchise business model. These operators make up the lion share (76% in 2015) of the China express delivery market in terms of parcel volume, and deliver the vast majority of parcels ordered on Taobao and Tmall.
For a brief overview of China’s major 3PL firms and Cainiao, please see Appendix 4.
How the franchise business model works is this: the franchisors invest in the line-haul network assets – trucks, planes and regional sortation centers – typically via leasing these assets, and in turn, charge their franchisees for using them.
Franchisees either focus their business on first-mile pick-up or last-mile delivery. First-mile pick-up is the process of moving merchandise from the merchant’s warehouse to the centralised sorting stations controlled by the franchisor. Last-mile delivery is the process of shipping the order to the customer from local delivery stations. Note that this model has spawned thousands of local franchisees/entrepreneurs.[44]
JD’s Advantage over Third-Party Logistics Firms
“When you own and manage your distribution and logistics channel, you have a great competitive advantage over companies that rely on third-party suppliers. It automatically shortens your lead times, but also you can constantly look for ways to improve your operation and try to make it more efficient. You never have to rely on what’s going on in somebody else’ shop. In our case, we generally know where things are in relationship to when we want them to arrive, so we can schedule and plan to move goods into the stores at the right time. That maximizes our in-stock positions, which is vital. You can’t generate sales unless you have the product there when the customer wants it.”
– Joe Hardin, Former Walmart executive vice president, logistics and personnel
JD’s nationwide fulfillment and delivery infrastructure allows it to provide same-day delivery to 137 cities and next-day delivery to 884 cities in China. Currently over 85% of orders fulfilled by JD are delivered on the same-day or the next. No other logistics or e-commerce company in China is able to offer such coverage.
JD’s logistics business is an end-to-end solution; this means that JD controls the entire value chain from procuring and storing the inventory, all the way to last-mile delivery. The only piece of the logistics process that is outsourced is the inbound shipping of goods from the supplier/manufacturing to JD’s fulfillment centers.[45]
Order Cycle Flow Chart for JD:
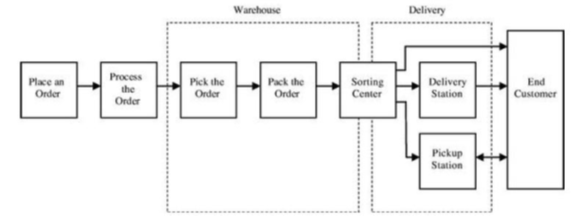
As shown above, the typical order for JD moves through two to three distribution layers: Warehouse/Fulfillment Center -> 1) Regional Sortation Center -> 2) Delivery Station -> 3) End Customer, or straight from sortation center to a pickup station or to the end customer. Unless cross-regional line-haul is required (an additional layer)[46], this is the typical logistics process for an order fulfilled by JD.
Here’s the typical transaction cycle for an order on Tmall or Taobao:
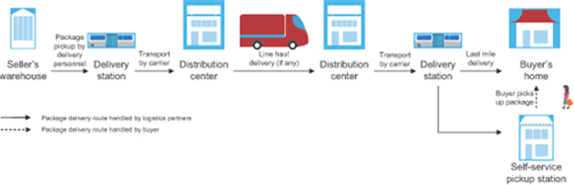
As shown, the order moves through at least 4 – 5 distribution layers (transitioning from the merchant’s warehouse or a Cainiao-owned warehouse to the 3P courier). Since most sellers on Taobao or Tmall are too small to have a national warehouse network, cross-regional line-haul is inevitable for orders going to regions without inventory.
This inefficiency stems from the fact that merchants operating on marketplace platforms typically manage inventories on their own, but lack the scale to build out their own in-house nationwide logistics network. With lesser overall volumes, a merchant may not have the right inventory available in the region close to the final destination; in consequence, an order usually takes longer and is more costly to deliver if line-haul services are required. 3PL firms that use a franchise model can only leverage the volumes they receive on their part of the value chain, which ultimately limits their scale longer-term as order volumes increase.
JD simply has a superior hub-and-spoke model with fewer layers of distribution and higher cost efficiencies; local economies of scale are achieved via a dense network of delivery stations that are strategically located around its self-owned fulfillment centers. As JD’s direct-sales volume increases, higher order density helps justify the economics of a denser warehouse network, higher line-haul frequency and a shorter last-mile delivery radius. Once order density reaches a critical mass within a local market, JD can group multiple orders together into a single route (since they have the SKUs available) with increased frequency vs. last-mile franchisees.
“We do not believe the franchising or subcontracting models for logistics, which tend to have limited value-added services, are able to provide the type of customized delivery services that JD can provide.”
– Richard Liu, JD.com Founder & CEO
The main weakness of the franchise model is that franchisors have limited quality control over their franchisees; service quality, as a result, is lower (Please see Appendix 3 for customer service scores for major 3PL firms). This is important because customers generally have direct contact with last-mile delivery staff.
Another issue with the franchise model is that the incentives are misaligned between the franchisor and franchisee. It appears that last-mile delivery franchisees are incentivized to generate greater volumes even by sacrificing profitability since there is a possibility that they could sell the franchise a few years later for a good ROI. JD management has stated, for example, that in some rural cities, last-mile franchisees are charging Rmb2-3 per parcel as promotions, which should be well below their break-even levels. The franchisors, however, care more about having a sustainable business long-term. Whether the franchise model will be sustainable over lower industry price-points remains a mystery, as the economics for the franchisees appear to be deteriorating in a highly commoditized environment.
Finally, third-party couriers do not use ‘open-box’ services or cash-on-delivery (COD), which is a service that Chinese shoppers love.[47] In contrast, JD’s delivery personnel are extremely well trained, are paid higher than average market salaries with generous benefits, and employee turnover is lower.[48] In fact, if you under-perform (too many late deliveries or customer complaints) as a delivery personnel at JD, you are likely to get fired promptly.
Overall, the barriers to entry in building a nationwide logistics network are substantial; it would take a lot of time, logistics know-how and capital for anyone who attempts to replicate JD’s network. Compounding the challenge is the fact that land located near strategic logistical hubs is difficult to secure due to misaligned local government incentives.[49] At the same time, a solid ROI is questionable as industry ASPs for express delivery services continue to decline while major input costs (labor, fuel, rent) are all rising well above the rate of inflation.
Given these challenges, and the fact that Alibaba/Cainiao’s strengths are not in managing asset-heavy businesses such as logistics[50], the probability of them expanding into last-mile delivery in any meaningful way is low. Instead, Jack Ma will likely stick to his strategy of taking minority stakes in companies with strategic logistics assets.
As JD continues to expand and densify its own network in lower-tier cities, it is well positioned to roll out a 2 – 3 hour delivery service in several years’ time, and thereby increase its overall lead in logistics.
Asia No. 1s and Fulfillment Leverage:
“Over the next 15 to 20 years, the real cost of building warehouses is going to be staggering.”
– Jeff Schwarz, Global Logistics Properties Co-founder
JD is currently operating around 213 warehouses (a majority of which are locked into long-term leases and have an average GFA of 25 – 35k sqm) with a total GFA of 4mm sqm. To meet future parcel volume demand, Richard Liu intends to expand JD’s GFA to at least 10mm sqm, likely over the next several years.
JD’s new Asia No.1 warehouses will drive this expansion. These are custom-designed, hyper-scale, and self-owned standalone warehouses, similar to Amazon’s modern day fulfilment centres.[51] The main benefit of these hyper-scale FCs are the incremental cost savings, (namely labor costs due to high automation) such as being able to sort more packages per hour.[52] More specifically, owning self-built warehouses will also help reduce long-term rental and labor inflation risks, and reduce order splitting.
JD currently has 7 self-owned fulfillment centers each providing a GFA of ~100k sqm. Management has stated that they intend to have a footprint of at least 25 Asia #1 fulfillment centers (“FC”)[53] longer-term.
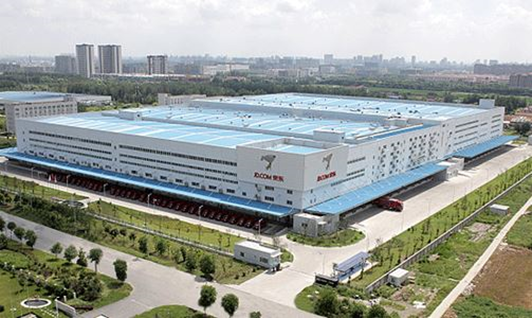
A picture of JD’s new Asia No.1 in Shanghai
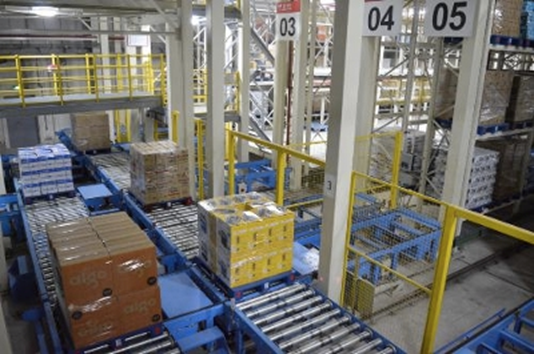
A picture inside JD’s Asia No.1 in Shanghai
The first phase of JD’s Asia No.1 FC in Shanghai (GFA of ~100k sqm) incurred total CapEx spending of around Rmb0.8bn. To be conservative, I assume JD will spend an average of Rmb900mm for every 100k sqm of GFA for its Asia No.1 capital budget.[54]
JD will need to construct 6mm sqm in GFA to reach their 10mm goal. In aggregate, I am modeling total cumulative CapEx spending of $5.5bn over 2016 – 2020 budgeted for Asia No.1 construction. This is well below the cumulative cash flow they will generate from working capital alone.
Core Business EBIT Bridge 2015 – 2020:
I am conservatively modeling flat to slightly positive leverage from fulfillment due to the heavy investment phase and aggressive expansion into lower-tier cities over the next several years. There is potentially meaningful long-term upside to my EBIT margin assumptions by as much as 100 – 200 bps as fulfillment[55] costs as a % of net GMV steadily declines. A scenario that captures a more automated fulfillment process (use of fully-automated, unmanned warehouses and an increased usage of flying drones, for example) is not difficult to imagine.
Most of the upside in operating margins will be driven by gross margin expansion. Base case, I think JD’s operating margin as a % of total net GMV can reach 5% by 2020.
JD Finance:
“In ten years, 70% of JD’s net profit will come from financial business.”
– Richard Liu at Growth Forum held by ZhongGuanCun 100 Club, March 2014
Business Overview
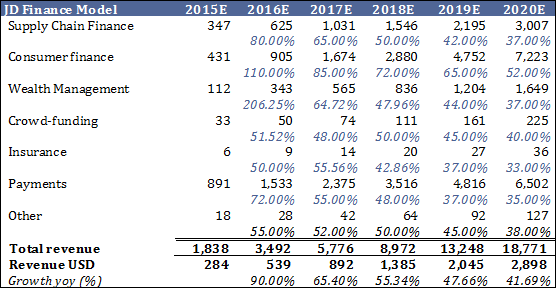
JD Finance began as an independent operation in July 2013; business lines include consumption loans (Baitiao), supplier and merchant loans (Jingbaobei and Jingxiaodai), Online Payments (JD Payments and JD Wallets), Crowdfunding and Wealth Management services. The business is currently making losses but the top-line has been growing in the triple-digit range.
Supply Chain and 3P Merchant Financing (~19% of total revenue) – Provides credit to 1P suppliers and 3P marketplace merchants. The total outstanding loan balance for supplier and merchant financing combined is around Rmb5.1bn as of 2015Q3, with average loan sizes at Rmb6mm and Rmb200,000, respectively.
I believe investors are overly concerned about the credit exposure of this business. Credit risk for 1P suppliers is de minimis, as the supplier’s inventory in JD’s warehouses collateralizes the loan.[56] Over 80% of the total outstanding loan mix for this segment is supplier financing. Supplier loan periods are very short: under typical industry payment schedules, JD pays the supplier right away; but instead, it offers supplier financing by charging the supplier interest over a 30-day period.
Rates for supplier and merchant financing are around 10% p.a.[57], which are very favorable compared to 18% for Ali Finance and 20 – 30% for comparable services.
Consumer Credit (~23.5% of total revenue) – Currently has around 2.5mm active burrowers, which is a very small percentage of JD’s total annual active customer base (155mm in 2015). At an effective interest rate of 11%, rates are typically much lower than comparable rates offered by state-owned banks; this service is particularly attractive for consumers who cannot get credit cards from the banks such as students.
Premium consumers are targeted where NPL is low at around 0.6 – 0.7%. But as this segment’s credit-evaluating system becomes more sophisticated, and as its database of consumer data expands, it could extend financing services to a wider consumer group. Credit risk could also be borne by a third-party via securitization.
At YE15, ending balances of consumer financing were around Rmb10bn, and the average loan size should be around a few hundred dollars USD. Non-performing assets (defined as receivables or loans more than 90 days overdue) accounted for only 0.2% of total volume, and coverage ratio was well over 300%.
Online Payments (~48.5% of total revenue) – Revenue model is a commission out of total transaction value. JD payments currently has around 500,000 merchants and 70mm active customers on its platform. The platform had a GMV of Rmb105bn in Q32015 (Rmb60bn on JD’s platform and Rmb45bn outside); this is around 50% of JD’s annual GMV.
This service is currently priced at zero percent commissions as a promotion to third-party merchants. Alipay and Tenpay dominant the online payments market with 50% and 20% share, respectively. Alipay charges 0.7% – 1.2% and Tenpay charges 0.6%.
Valuation Post IPO: Massive Upside Potential
The future growth potential of this business is very attractive as it benefits from a massive total addressable market; China’s SME and consumer financing markets remain in their infancy as the state-owned banks are highly risk averse. Most of the Chinese population is severely under-banked; only 20% of Chinese adults have a credit score from the PBOC.[58] Moreover, the state-owned banks are widely hated, as service in general is atrocious (line-ups at certain bank branches can easily last up to 30 – 60 minutes).
JD Finance’s lower customer acquisition cost (via online distribution) and its rich database of transactions are its main competitive advantages over China’s state-owned banks. Having a longer transaction history with its customers allows JD to better assess credit risk than the banks.
I think we are only in the early innings of the internet disrupting traditional banking in China. Similar to how mobile has leapfrogged PC/desktop, and e-commerce has leapfrogged offline retailing, online banking will eventually leapfrog traditional banking in China. Why is there a need for any physical branches at all if consumers are comfortable with banking online and if the services offered by financial technology companies such as JD Finance have a superior value proposition?[59] The only major roadblock could be stiff regulations; but over time, the rationale for banking services to shift online appears sound.
Lending Segment Growth:
Both the supply chain and consumer financing segments should continue to grow rapidly, driven by increasing customer penetration, larger average loan sizes, and the overall growth of JD’s e-commerce business. Management’s focus right now is on improving risk management over short-term profitability.
In terms of the growth potential of the consumer lending business, Rakuten is a potential benchmark. Rakuten is the largest e-commerce platform in Japan has around 40% of its shoppers using credit cards and outstanding consumer loans represent 30% of its total GMV. I have modelled much more conservative long-term growth and penetration rates for all of JD Finance’s lending segments.[60]
In addition to traditional interest revenue from loans to suppliers, merchants, and consumers, as JD Finance’s customer database grows there is also the potential to expand into third-party credit rating services, which is typically a very attractive, asset-light business with high barriers to entry.
Online Payments Growth:
This segment also has massive potential as online payments can be a great business with fantastic incremental margins once a critical mass of merchants and payers is achieved. I expect in-house GMV penetration to increase modestly as it is already around 50%.[61] Given JD Payment’s relatively small market share, it is conceivable that once JD Finance is IPO’d out of JD, a partnership or JV with Tenpay could be considered, which would leverage additional synergies from data sharing and greater incremental market power.
Independent Company Valuation:
JD Finance’s business is currently quite synergistic with the core e-commerce business. However, due to the inherent conflicts of interest between the payments division and e-tailing[62], I think it’s inevitable that JD Finance will become an independent, publicly-traded company. Another benefit of separating JD Finance from the holdco is the elimination of the negative drag on JD’s operating cash cycle.
In the event that JD Finance goes public, the value discount assigned by public market investors on this business will likely collapse. I think JD Finance will be a very high multiple business if freely traded, especially if management decides to pursue a more asset-light lending model.[63]
Whether management eventually decides to pursue an asset-light or a pure lending model[64], this business will become more valuable over time. PayPal as a publicly-traded comparable is a dominant online third-party payments operator with a more mature growth profile; it trades at 4x 2016E revenue. I think JD Finance is much better managed than PayPal, and has a much more attractive long-term growth profile. At 5x 2020E sales of $2.9bn, JD Finance could potentially be worth closer to $14.5bn by 2020, or $12.3bn post-dilution to JD equity holders.[65]
Management & Corporate Governance:
- Founder & CEO Background: A Rare Breed
“Investing in a project is primarily investing in a person, and I have spent a lot of time looking for a Killer entrepreneur. For my first meeting with Liu Qiangdong (Richard Liu), I noticed his computer whereon he had written “The Best or Nothing”, which convinced me that he was just the person I had been looking for. Liu Qiangdong started up his (first) business ever since his campus life. In my eyes, one that starts up business on campus is rarely driven by his own desire for fame or money but by his born nature of entrepreneurship. Furthermore, an entrepreneur on campus must be brave and good at personnel management. Liu Qiangdong was a social science major and taught himself programming. Having no computers of his own at that time, he had to take a bus for one or two hours to a relative and waited for an opportunity of doing programming exercises on the computer until the evening when the workers came off duty. After he learnt it he programmed for others and made profits thereby. Later he opened a shop at Zhongguancun where he sold more CD writers than any other peer, and the situation was likewise good for his CD business later. His experiences impress me with his cleverness and entrepreneurship. In addition, he is also an honest man who tells you everything instead of the flattering remarks only, which pleases me a lot.”
– Kathy Xu, Capital Today
In a market with a reputation for spawning frauds and atrocious corporate governance, JD stands out with an exceptionally high-integrity CEO with great respect for the interests of minority shareholders. I believe the best way to illustrate Richard Liu’s character is through sharing stories that revolve around how Liu has dealt with JD’s major stakeholders in the past. Many of the stories below are rough translations from the book “The Founding of JD.COM”, a biography on Richard Liu and the JD story (the English version of the book, “The JD Story: An E-Commerce Phenomena”, is coming out in September and available for pre-order on Amazon).
High Integrity:
Early CD business
When Richard started his CD business, he had no supplier relationships, no capital, no customers and no team. He started everything by himself, insisting on selling genuine, branded products, and refusing to bargain with customers. The business grew mostly through word of mouth as the customers felt his prices were reasonable and he was one of the very few vendors who did not sell knockoffs, even though at the time it was very easy to produce knockoff CDs – all one had to do was print a logo on an empty disk and replicate the cover. The gross margin of selling knockoffs was multiples of that of retailing the real product.
One of the early practices that he insisted on was issuing receipts to customers (which the counterfeit sellers never issued for fear of being busted by the police). Every order would be followed up with a receipt to prove to the customers that they were getting the real deal. When the company was once audited by the government for three days, officials were surprised to find not a single dollar of evaded taxes (VAT), zero knockoffs and zero counterfeit CDs.
Private Round with Tiger Global
In 2009, Tiger Global offered to invest in JD at a $200 million valuation. Richard took the proposal to the board, and after some discussion decided to counter propose with a $250 million valuation. After Tiger immediately took the offer, Richard realized that they got lowballed and Tiger must have had much better expectations for the business.
At the time JD was in discussions with another fund for the financing round. That fund offered to invest at a $300 million valuation; if JD accepted that offer instead, the dilution would be less severe than Tiger’s deal.[66] One of Richard’s executives argued that since the agreement with Tiger was only a verbal promise and had not been set in formal writing, they should take the superior offer instead. Richard refused: “Great leaders must all fulfill their promises. If your words mean nothing, how can you lead a company?” At the end, JD took Tiger’s investment.
Tiger learned about this episode shortly after, and proposed an additional investment at a $700 million valuation (presumably because they felt bad and to make up for the difference). Richard replied by saying that JD didn’t need any more money and if Tiger wanted to increase its stake they would have to buy shares from other shareholders instead.
Capital Today
In 2008, some people (presumably investment bankers?) proposed to Richard a scheme to push out Capital Today as a minority shareholder, which would deliberately lower the valuation of JD and allow Richard to issue a ton of stock to enrich himself. Richard again refused: “Capital Today helped JD get through its most difficult period. I must honor the agreement I signed.”
Capital Today was JD’s first outside investor. Kathy Xu, Capital’s Today’s founder, once told Richard that she would be happy to make 10x on her JD investment. Richard told her that he wanted her to make at least 100x. Upon JD’s IPO in 2014, Capital Today ended up realizing a 160x return on their investment.
Hillhouse Capital
Hillhouse’s Zhang Lei and Richard Liu met at an Internet conference in late 2009. Both had been graduates of People’s University in Beijing. After Richard gave a talk at the conference, Lei approached him asking if he needed capital. “Of course, but most venture capitalists don’t understand me.” At the time, investors favored businesses that were capital light (like Alibaba’s marketplace model), and most internet entrepreneurs built their businesses that way to appeal to investors. Richard refused to characterize JD that way: “JD is capital heavy. The only way to ensure that the customers can get the best service quality is to be capital heavy and control the delivery process.”
Lei found Richard’s candidness to be rare, and decided to make an investment after chatting with him for just two hours. Lei asked Richard how much cash he needed; Richard asked for $50-$75 million. “Either you let me invest $300 million, or I won’t put in a cent,” Lei replied. Allowing Hillhouse to make that large of an investment would make the hedge fund JD’s largest shareholder. The end solution was to allow Hillhouse to invest $265 million, and Richard would retain control over the board through super voting rights.
Conservative, but also Ambitious:
Capital Today Investor Agreement
In the original Capital Today investor agreement, there was one contingency term where if JD achieved certain growth targets, Capital Today would give away some of their shares to JD executives as a bonus. A partner at Capital Today phoned up Richard asking to set near-term sales targets. Richard’s original proposal was this: Rmb 350 million in sales by 2007, and Rmb 1 billion by 2008.
These were almost unthinkable milestones at the time because JD had only generated Rmb80 million of revenue in 2006 and the targets effectively implied that they would grow 4x in one year and another 3x the following year. “are you kidding me?” The partner thought.
Capital Today became concerned that the company wouldn’t achieve those targets and would in the process hurt morale, and therefore negotiated a more reasonable plan whereby JD would aim to double its revenue consecutively every year for the next four years. In reality, JD achieved Rmb 360 million of sales in 2007 and Rmb 1.3 billion in 2008, handily exceeding both of the original targets that Richard proposed.
“Even if JD can get 100 points (in performance), we would tell our investors that we forecast 80, 90 points. It’s better to be a little conservative, even if that means in the short run our stock only reflects 80, 90 points. We will know that the company is really 100 points when our results come out and speak for themselves. Conservative communication is key to building investor trust and confidence. The only thing we care about is maximizing the long-term value of the company, not maximizing the short-term stock price.”
– Sidney Huang, JD.com CFO
Reported Numbers Unlikely Overstated:
It can never be guaranteed to non-insiders, but based on these stories, I find it highly unlikely that JD is a fraud. What’s more likely is that Richard is one of the most impressive entrepreneurs and CEOs in China, and has higher ethical standards than the vast majority of Fortune 500 or S&P 500 company CEOs.
Moreover, now that JD is a publicly-traded, SEC-registered company, any shareholder unfriendly actions would be much more heavily scrutinized and likely a greater blow to Richard’s reputation than if the company was still private.
In fact, even during the company’s early days, in order to ease investor concerns over the company’s finances, Richard would let investors pick a random week and mail all of that week’s reports to the investor straight from the ERP systems. The logic was that no company could fake data 365 days a year and it was extremely unlikely that Richard would get weekly reports containing fake data. JD had no audited financials during that period as they couldn’t afford an auditor yet. PWC is now JD’s auditor, and they are by far the best auditor in China.
JD’s direct-sales competitors (Dangdang, Suning, Gome, and Amazon China) are all struggling in terms of performance (and they have no incentive to report bad numbers), suggesting to me that someone else has to be doing well. In contrast to Amazon, there is a lot more disclosure of KPIs and relevant operational metrics contained in the 20-Fs, including: reported GMV, the number of merchants, suppliers, SKUs, orders, and annual active customers.
Finally, Richard is not an empire-builder. He cares deeply about maximizing shareholder value per share given that he respects the company’s minority shareholders as illustrated by his past actions. He certainly cares about growth, but not growth at any price. And he definitely cares a lot about profitability.[67] As a result, I think he is less likely to pass on an excess of economic surplus to consumers like Jeff Bezos of Amazon and Costco may have, for example.
- Company Culture: Militaristic, Familial, and Performance-Oriented
“If we don’t work hard today, tomorrow we will go bankrupt.”
– JD.com company saying
Part of understanding how JD was able to beat its early competitors such as Amazon and Dangdang (who were among the earliest entries into China e-commerce) is by studying its culture.
First of all, hiring the right people is extremely important. Hiring the right people, and training them well reduces employee turnover, which in turn reduces costs. JD specifically looks for recruits from a working class background who are fresh out of college for their management trainee program (candidates are not allowed to have prior work experience). Management trainees are actually sent to military school for their first week of training, and must perform delivery duties for their first six months to learn the basics of the business.
Fast execution, and accountability are very important. Similar to the key ingredients of success at FedEx and UPS, (which are both asset-heavy, logistics businesses with large express delivery divisions), perfecting a supply chain requires timely execution and an employee workforce that operates like a military unit. In addition, other similar aspects between FedEx/UPS and JD include the fact that these companies almost always promote from within (lifetime employment is common), employees hold a lot of stock and everyone has equal respect, regardless of rank.
Layered on top of JD’s ruthless efficiency is a maniacal focus on customer experience. JD has a delivery policy labelled “211 program” where the company guarantees that items placed before 11 AM are delivered before 6 PM on the same day, and items ordered after 6 PM (before 11 PM) must be delivered to the customer by 11 AM the next day. There is no E-Commerce company anywhere in the world (including Amazon) that is able to match JD’s delivery speed. Delivery personnel are required to build relationships with customers; receiving over a certain number of complaints would result in automatic dismissal for the delivery person. Likewise, if a customer complains about receiving counterfeit products, when verified, the purchasing manager responsible for sourcing the product is automatically fired.
“JD.com features strong execution….Once we attended a meeting lasting from 9:00 am to 6:00 pm. After the meeting was over, everybody rushed to the front of the meeting room to see a PC screen. I wondered what they were looking at and then found out that all the 68 issues discussed during the meeting were shown on that screen, attached with the respective persons in charge and deadlines. I think that this is what makes JD.com outstanding. While Liu Qiangdong was studying at Columbia University, his team was still as efficient as before during telephone conferences.”
– Kathy Xu, Capital Today
Having the right system and culture in place has allowed JD to scale up its operation at an astonishing speed without compromising quality. In the last eight years alone, JD has expanded from a 50-personnel company to an 110,000-employee powerhouse. I am aware of no large company in the world that has expanded so fast in such a short a period of time, especially when the task involves the complex integration of large white-collar and blue-collar workforces into one cohesive, high-performing unit.

A picture speaks a thousand words…
- Track Record: Strategy and Capital Allocation
Up until this point, Richard has largely made all the right long-term strategic decisions for JD, despite some of these decisions not being very easy to make, or even against the view of major investors. Here’s a summary of some of the key events/decisions made by Richard throughout JD’s history:
-The decision to shift the entire business online in 2004. This was done in spite of the fact that 95% of the revenue of JD at that time were in brick & mortar electronics wholesale. I think the decision to forgo all that short-term profitability and have the vision to see where retailing was ultimately going to is incredibly impressive.
-The decision to invest heavily in logistics starting in 2007. This decision was against the advice of a major investor, but Richard saw the need to own an in-house logistics network in order to provide a higher-quality delivery service to customers. The logistics business has turned out to become a great asset and a key competitive differentiator.
-The decision to expand JD’s product categories beyond electronics in 2008. This was also against the advice of a major investor, likely because of the executional risk of holding new inventory in additional categories that have non-standardized SKUs.[68] In retrospect, diversifying the overall product sales mix away from electronics was a very wise decision, and this shift remains on-going.
-The Strategic Partnership with Tencent completed in 2014. I will discuss this deal in greater detail in the valuation section. In general this was a fantastic deal that just made all the right sense in the world, and was brought up originally by one of JD’s large investors.
“Over a decade since the inception of the company, Liu Qiangdong’s most correct strategy was to increase stock keeping units (“SKU”). Particularly, selling books was a very shrewd move, which cut down the average transaction value (“ATV”) at not too much cost, and thus lowered the threshold for the first shopping experience of a new customer to JD.com. The ATV for IT product sales is around RMB 800, which makes a new customer hesitate as he might doubt the authenticity of the product. However, if the customer buys a book at about RMB 80, he faces a lower threshold. Besides, if he feels highly satisfied with the extremely fast delivery of the book, he will immediately make his second purchase.
When increasing SKUs, we worried about the adequacy of our capital. However, Liu Qiangdong stuck to the strategy rather determinedly. At that time, although I agreed with him, I was still afraid that our capital chain might break, because our money was not that much and a loss was to be initially suffered for each SKU added. Finally, Liu Qiangdong insisted on increasing SKUs before we ran out of money. The second correct strategy was Liu Qiangdong’s inception of warehousing logistics business when the company received its second investment. At the time, Ma Yun, Executive Chairman of Alibaba Group, was not willing to be engaged in any capital-intensive asset business like warehousing logistics. Therefore, JD.com embraced a three-year non-competition period. Liu Qiangdong implemented this strategy very persistently, because 70% customers were not satisfied with delivery services. At the beginning (of the company’s warehousing logistics business), we were suffering huge pressures, because a delivery center was to be set up for each city newly covered by our network. As a matter of fact, the company was suffering losses for only 20 orders per day in a city. It would not break even until 2,000 orders were received per day in a city. Nevertheless, it took a long time from 20 to 2,000 orders per day in a city. Being suffered for six months in some cities and for a couple of years in some others, the losses totaled a tremendous amount when 30 cities were covered. Liu Qiangdong, with firm conviction and really far sight, has realized the necessity of warehousing since very early.”
-Kathy Xu, Capital Today
I think these decisions indicate that Liu is open-minded and willing to listen to the advice of JD’s long-term investors, yet he is also intellectually independent in being able to exercise his own judgement when making the right decisions for the business despite when at times hearing differing views from his investors. In my view, this is a rare combination of traits in the business world.
- Compensation Structure / Incentives:
Richard’s incentives are properly aligned with shareholders and for long-term value creation. He founded the company and is an owner-operator who holds around a 20% stake of the equity (valued at ~$6.7bn). Richard has sold very little stock since the IPO in 2014.
In 2015, Richard was granted 13mm ADR options at a $33.40 strike price, subject to a 10-year vesting schedule with 10% of the option values vesting every year. A 10-year vesting schedule is quite a long time-horizon in the realm of typical executive compensation, and indicates that the CEO and the board, like they have been, are focused on long-term value creation. In addition to this option grant, Richard virtually gave up all his cash compensation for the next 10 years. He now takes an Rmb1.0 annual cash salary with no annual bonus. Employee compensation is also heavily tied to the long-term performance of JD shares.
Interestingly, JD recently introduced two new KPIs for 2016 – operating profit and cash flow days (AP – days inventory days). Prior to these new KPIs, net GMV and total revenue were the main KPIs in which managers were incentivized on as part of their annual compensation package. The new KPIs for 2016 potentially mark a shift from focusing on top-line growth to profitability.
Valuation & Key Growth Drivers:
TAM is Massive:
Big picture, the overall macro themes driving this story are simple, powerful and inevitable:
- Chinese consumption is growing 10%+ per year. Savings represent a whopping 50% of China’s GDP, by far the highest of any major economy in the world. Consumption, which is the inverse of savings, is only 37% of GDP. As was the case with Japan in the early 1970s and Korea in the early 1990s, when middle-income countries start making the transition into developed economies, consumption growth generally accelerates on the back of slower overall GDP growth. China is no exception to that trend. While consumption is less than 40% of total output, incremental consumption growth currently accounts for 60-70% of incremental GDP dollars.
- Online shopping penetration is increasing. Unlike most developed economies where brick and mortar retail had a 50-100 year development lead over E-commerce, China’s brick and mortar retail industry started at the about the same time as E-commerce (late 1990s vs. early 2000s). Critically, this means offline retailers never had the chance to build up significant scale and supply chain advantages over their online counterparts. This has allowed E-commerce to leapfrog at a speed that far outpaces the West. China also has a number of idiosyncratic characteristics that greatly benefit E-commerce, such as a high urban density (everyone lives in apartments which lowers delivery cost dramatically), urban pollution (discouraging people from shopping outdoors), and infrastructure imbalances (much worse traffic, huge shortage of urban parking space). Over the next 15 – 20 years, I expect the great majority of Chinese retail consumption to move online.
- Barriers to entry in online retail are much larger than offline. Alibaba and JD on a combined basis control close to 90% of the E-commerce market and are gaining share at the expense of tier 2 players. On top of that, JD is taking share from Alibaba (especially Taobao), having grown its GMV at roughly 2-3x the speed of the larger rival.
Internet penetration in China is around 50%, and online shopping penetration is around 60%. With nearly $70bn in reported GMV in 2015, whether you use total online shopping GMV[69] ($640bn in 2015), total retail GMV[70] ($4.6 trillion in 2015), or B2C GMV ($342bn in 2015) as a proxy for JD’s TAM, the growth runway is enormous.
If we take China’s B2C GMV as a proxy for JD’s TAM (most conservative), JD’s current market share is 20%. By 2020 I think total B2C transaction volume can top $1 trillion USD (assuming a mid-20’s 5-year CAGR)[71], and JD with its higher growth profile can increase its total share closer to 27%. At the same time, it should be able to extend its existing massive lead on the direct-sales side.
Key Operational Metrics:
Robust annual active customer growth and an increased frequency of annual orders per active customer will be the main drivers of JD’s net GMV growth. I estimate that customer-level IRRs are already well into the triple-digits.
As new customers develop stronger online shopping habits over time, their annual frequency of purchasing online gradually increases. JD’s 2008 cohort of active customers, for example, have ramped-up their annual frequency of orders from 3.7 annual orders in 2008 to 21.8 in 2015. In addition, an expanding selection of products on JD’s platform will likely lead to an increased frequency of purchases. It isn’t difficult to imagine JD’s total active customer base making online purchases at an average of once per month (or 12x per year) by 2020 from 8.1 annual orders today.[72]
Assuming that JD’s annual active customer base grows at a mid-20’s CAGR over the next 5 years, (from 155mm in 2015 to 450mm – 500mm by 2020) JD’s penetration of total internet users and online shoppers in China will remain at relatively modest levels of 45 – 55%.
Strategic Partnership with Tencent[73]: Mobile-driven Customer Growth
The strategic partnership with Tencent completed in 2014 has accelerated JD’s GMV growth profile by providing convenient access[74] to JD’s shopping app for Tencent’s large base of WeChat and Mobile QQ users.
Mobile application technology has revolutionized the way people communicate and Tencent owns the premiere online communications/social media properties in China. WeChat in particular is a rapidly growing, mobile-only, ubiquitous social media/communications app with nearly 700mm MAU as of 2015YE. As mobile’s total share of internet usage continues to grow, more time is increasingly spent on “Super Apps” such as WeChat that have considerable consumer mindshare. WeChat has brilliantly integrated a highly frequent[75], high-utility activity (communicating online) with local life services[76] within its own app. In essence, WeChat can be thought of as a portal to the mobile internet since it has its own set of integrated third-party apps on its sticky platform – or an app within an app.[77]
I expect JD’s penetration of WeChat and Mobile QQ’s users to continue to increase over time on the back of increasing mobile penetration, which should help drive robust customer growth for JD.[78] In Chinese rural/lower-tier cities, mobile adoption has largely leapfrogged PCs, and these under-penetrated markets will be large growth avenues for JD.[79] Over the past few quarters, WeChat and Mobile QQ accounted for roughly 20%-25% of the incremental growth of JD’s customers.
For a summary model of the relevant top-line projections, please see Appendix 8.
Valuation Summary:
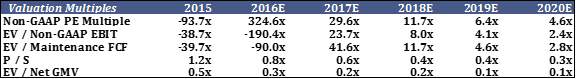
[80]
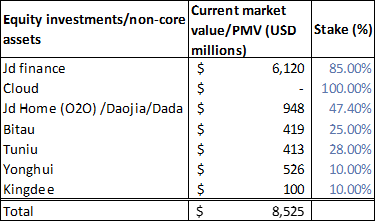
At $24.22 per share, JD has a market capitalization of $33bn and a TEV of $28bn with a strong net cash position. If we back out JD Finance’s valuation based on its latest PMV, JD’s TEV is closer to $22bn.[81] JD also holds a portfolio of non-core, hidden growth assets and stakes in publicly-listed equities.
The public cloud infrastructure business remains at a nascent stage. Richard hopes that this unit becomes a meaningful revenue and profit stream in a couple of years. Given the massive economies of scale required, it is possible that JD will eventually form a JV or partnership with Tencent’s much larger cloud service unit. The industry itself is attractive for scale players such as Alibaba, and given its early stage will likely grow at 100-150% per annum over the next several years.
JD Home/Daojia is also an early-stage growth business and has an Uber-like, on-demand business model. Launched in April 2015, JD Daojia is an online-to-offline (O2O) delivery platform that provides consumers with two-hour delivery of goods from local supermarkets with its location-based app. A few weeks ago, Daojia and Dada Nexus (China’s largest crowdsourced delivery network) agreed to merge, which will further increase local economies of scale as the two delivery networks combine assets. JD will hold a 47.4% stake in the new pro-forma company. Please see Appendix 5 for a brief overview of my notes on JD Home/Daojia.
Summary of my estimates of the current value of public equity stakes and privately-held “non-core assets”:
Model Drivers: Net GMV Growth and EBIT Margin
In 2015, JD’s core business reported $69bn in reported/gross GMV, which equates to roughly $47bn in net GMV assuming a mid-teens combined return and cancellation rate and 15 – 17% VAT taxes. I am modelling a net GMV[82] range of $175 – $225bn by 2020 (assumes a 30 – 37% 5-year CAGR range, with 3P GMV growing faster than 1P).
The great thing about this idea is that as long as I’m directionally correct on the key business drivers, I believe a permanent loss of capital over a 5-year time horizon is a remote possibility; whether JD turns out to be a $100bn or $300bn net GMV business in 2020, the margin of safety afforded by the current valuation is massive. To highlight how ridiculously undervalued the equity currently is, just the total FCF generated over the next 5 years alone could make up more than 120% of the total current enterprise value today. This is a great benefit of owning a business that operates with an increasingly favorable working capital position over time.[83]
Richard Liu has stated that he hopes to achieve a similar margin profile to Walmart long-term. I think a 3 – 5% operating profit margin range as a % of net GMV would be a very realistic margin profile for JD 5 – 7 years from now.
Base Case:
JD is a $200bn net GMV business by 2020, and earns a 5% operating profit margin on net GMV (~$10bn in EBIT). At an 18x EBIT / ~25x maintenance FCF exit multiple[84], along with adding the current value of all the public investment stakes/non-core assets, (with the exception of adding the projected 2020 value of JD Finance) and summing the incremental FCF that will be generated in the interim, JD shares could potentially be worth $160 by 2020, providing a total return of 570% and a 45% IRR over a 5 year period. Note that this valuation assumes that all the FCF generated over the next 5 years (around $26 – 27bn) will accumulate on the balance sheet at a 0% reinvestment rate.
Please see Appendix 7 for my detailed base-case modelling assumptions.
This target valuation implies an EV / net GMV multiple range of 0.8x – 1.0x in 2020, which appears quite reasonable relative to offline and online retail comps that frequently trade at similar or even higher multiples even though they may be operating in shrinking or very mature growth environments. Post terminal year, JD’s GMV can easily double again over the following 5 successive years given the massive growth runway.
JD’s return on incremental invested capital is also improving over time.[85] If we back out the excess cash that will build on the balance sheet, returns on capital approach infinity.
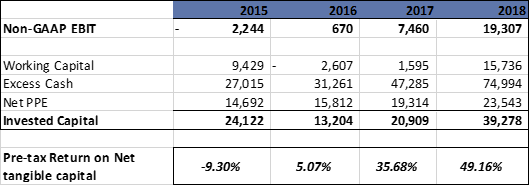
Cyclical risk is also minimal as growing internet and e-tailing penetration will greatly outweigh any short-term economic weakness, along with JD being able to take market share from weaker competitors in a more challenging economic environment. The balance sheet is also very conservatively managed.
These factors alone suggest that a 25x multiple on 2020 earnings power could be severely undervaluing the equity.
My Base Case Numbers vs. Street Consensus:
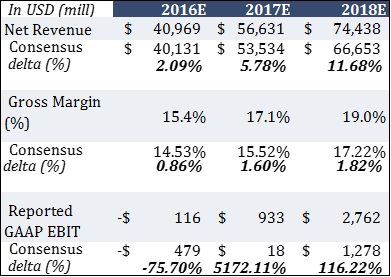
Grand Slam Scenario:
For a business operating with huge barriers to entry, high returns on invested capital, and a secular growth profile more attractive than all of its relevant publicly-traded peers, I don’t think a 50x multiple on 2020 earnings power is an unreasonable assumption.[86] Assuming a 6% margin on net GMV of $225bn, JD could be earning $10bn in maintenance FCF by 2020. On a 50x multiple or 2% yield ($500bn valuation or 37x 2020E EBIT), JD shares could be worth $400/share by 2020 for a total 5-year return of 1,500%.
Maybe this isn’t a 50% probability, but it’s definitely not zero either.
The highest-quality compounders (led by the top management teams) are typically perpetually undervalued by the market because investors fail to price-in future value creation from leveraging a powerful flywheel or sustainable competitive advantage to expand into untapped and adjacent markets with considerable TAM potential. Customer and transaction data, for example, are typically under-appreciated intangible assets that high-quality compounders use to expand into new markets.
Downside Case:
If JD only earns a 3% operating profit margin (low-end of Liu’s target) on $175bn of net GMV, (around $5bn of EBIT by 2020), the stock trades at less than 5x 2020E EBIT. I think JD will still likely generate at least $15bn of FCF over the interim years in such a scenario. As a result, the shares could still compound at 25% per annum on a reasonable 15x exit multiple on EBIT.
What can go wrong? / Key risk factors
- Political Risk / Adverse Regulations. JD shares are listed on the NASDAQ as an ADR via the VIE holding structure, which is essentially a legal loophole used by domestic Chinese companies to allow foreign investors to invest in their securities. The concern here is that the Chinese government may potentially nationalize the value of foreign investors’ holdings in these securities.
Mitigant:
First of all, let’s think about what would happen to China if they actually wiped out foreign investors by eliminating the VIE structure and not replacing it with an alternative: 1) It would cause permanent collateral damage to China’s international reputation, 2) All domestic Chinese companies will likely become uninvestable for foreign investors, which means they won’t be able to ever raise any foreign capital (this would likely cause considerable damage to domestic financial markets and the general health of the Chinese economy), 3) Since this is akin to seizing the assets of foreign investors, there will likely be a massive retaliatory response from major economies globally; this could range anywhere from a trade embargo to more serious measures. With such adverse potential outcomes, why would President Xi even consider such a move?
It is also important to note that this structure has been around for well over a decade, which suggests that the Chinese government has de facto endorsed it. So unless you think WW3 is going to happen (which means you probably don’t want to be invested in any Chinese ADRs), I don’t see forced nationalization of foreign capital as a viable solution, and likely an extremely remote possibility.
What’s more likely is that the government will either eventually formalize the legality of the VIE holding structure, or reform it (propose an alternative structure whereby foreigners can legally invest in Chinese ADRs), or simply leave it alone. The reason the VIE structure exists in the first place is because the Chinese government doesn’t allow foreigners to have control over domestic technology companies (the internet sector is deemed critical to national security). Public opinion is currently being gathered regarding the treatment of VIEs, and progress towards a favorable solution to all parties appears promising.
JD’s business is also not a politically-sensitive one. In fact, adhering to a business model of only selling authentic products to consumers seems like a very honorable one, particularly in China. JD’s value proposition to Chinese consumers is massive. Customers in general love the business, and as a result, the company has substantial political capital. In fact, JD could be the perfect role-model for how a business should be run in China from an ethics point of view.
- Massive tail-risk event of major Rmb Currency Devaluation. (If your base currency is not Rmb.)
Mitigant: This risk could be easily hedged out (at a relatively low cost) by shorting the entire Rmb exposure proportional to the size of the investment.
- Key Man Risk – Richard Liu is very important to the business.
Mitigant: Liu is only 42 years old, which means he can potentially be CEO for a very long time to come (though at 42 he already has more than 20 years of business experience). As such, his youth is a massive advantage, similar to how a young investor has a long runway for compounding knowledge and capital.
- The share price is depressed, and insiders know it. There is always the risk of a management buyout to take the company private at a depressed valuation, and then re-list in the A-share market (at a presumably higher valuation) in an arbitrage-style transaction. Competitor Dangdang, for example, is looking to go down this route.
Mitigant: Given his track record, I trust Liu to not screw over minority shareholders. He has stated specifically that he understands the stock may be undervalued from time to time, and that easy money can be made by going-private and engaging in valuation arbitrage, but he rather focus his time on improving the business.
“Real entrepreneurs build value by creating real products, not by financial engineering.”
– Richard Liu, JD.com Founder & CEO
Event Path / Catalysts:
Timing is always tricky, but I think the set-up looks particularly attractive post the next 6 – 9 months. My numbers are materially higher than Street estimates over the next few years, and the shares should re-rate and compound accordingly over time. Over the very near-term, if you care, the stock will likely trade on reported Revenue/GMV figures, and along with general Chinese equity market volatility, but really, who knows?
Richard has stated that he expects to spin-off at least 2 listed companies in the future (most likely JD Finance and JD Daojia in my view). A good portion of shares in these subsidiaries will be allocated to employees.
- Early 2017 timeframe: IPO of JD Finance in the A-share market. This would provide a clean set of reported financials for investors to value JD Finance independently. Separating JD Finance will also remove its associated losses off JD’s reported earnings and remove the negative drag on working capital.
- By the end of Q2, de-consolidation of the O2O unit JD Home/Daojia post-merger with Dada, which will remove current losses off the reported PnL statement. In the event that this business gets separated from the holdco, it will likely trade at a very high multiple.[87]
- Eventual de-coupling of the performance of share prices between large-cap Chinese internet stories vs. the general Chinese equity market. Recently reported earnings from large-cap, high-quality, internet-based growth stories (eg. JD, Baidu, Tencent) have remained very strong and above Street expectations in light of a slowdown in Chinese economic growth, indicating that the Chinese service economy and consumption spending remains robust. The market may eventually better appreciate the resiliency of these earnings as they continue to roll-in over the next several Qs, and appropriately re-rate Chinese large-cap internet names higher.
- My belief is that one of the best times to generally own a stock (especially one that reports negative earnings) is when margins are on the verge of a major inflection point.[88] Starting in 2017, I believe JD is on the verge of a prodigious multi-year ramp-up in free cash flow generation.
Summary Conclusion
JD carries the rare, perfect trifecta of characteristics that are typically highly sought after in an investment idea: a phenomenal CEO/management team, a stock price reflecting severe undervaluation, and a fantastic business model with earnings power growing at an attractive rate over time. As a bonus, it has a patient, long-term fundamentally oriented shareholder base that is able to provide smart strategic advice to management.
I am extremely challenged to find a more attractive long-term investment opportunity in the markets today, and suspect I won’t for a very, very long time.
Buffett has talked about facing the choice of investing only in a handful of opportunities within one’s lifetime. For long-term fundamental investors, I think JD qualifies as a real punch card investment.
Appendix:
- Chinese Online Shopper Survey
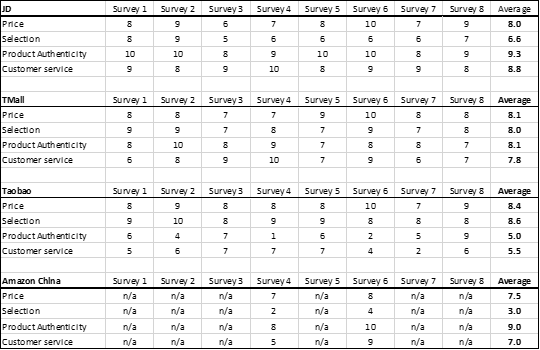
- Price Comparison Results
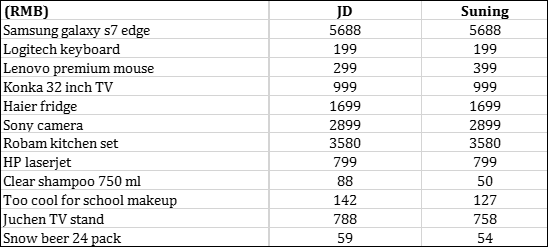
- Third-Party Logistics Customer Satisfaction Score
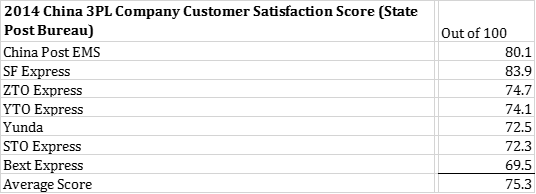
- Brief Overview of Main 3P Logistics Competitors
China Smart Logistics/Cainiao:
Cainiao was established in May 2013 and is a joint venture between Alibaba, Intime Retail, Fosun International and several other 3PL firms. It aims to provide up to 24 hour nationwide delivery once the order is placed online in 2,000 Chinese cities. Cainiao is a bit misunderstood by most investors; the business does not provide any line-haul or last-mile delivery services. Instead, Cainiao is essentially a 4P logistics business: it leverages big data from the Alibaba ecosystem of customers and merchants to improve logistics efficiency with third-party logistics firms.
Recently, Cainiao has started investing more heavily into fulfillment centres/warehouses to meet the growing e-commerce demand. On average orders on Tmall can take from 2 days to 1 week to reach the customer.
Cainiao assets:
Provinces covered: 31
Delivery stations: 97,000
Delivery personnel: ~1.5mm
Collection points: 25,000
Premium Express Operators: SF Express
SF Express dreams to become a Chinese FedEx, trying to build a ‘premium quality’ image. SF Express offers free shipping for any order over Rmb199, for orders below Rmb99, delivery fee of Rmb10 per order is charged.
EMS:
EMS has the broadest nationwide logistics coverage; however, due to its state-owned background, it is not very service friendly and is the most expensive.
SF Express assets:
Workers: 340,000
Transport vehicles: 12,000
Service centres: 12,000
31 provinces, 900+ cities, 1,900+ counties
2014 express volume (mm): 1,200 (1.2bn orders)
Market share: 9%
Customer satisfaction score: 83.9
-building four cold-chain warehouses in Beijing, Guangzhou, Jiaxing, and Xiamen
EMS assets:
All cities and counties covered
45k storefronts, 105,000 employees, 36k vehicles; 2014 express volume (mm): 1,200, 9% market share, customer satisfaction score: 80.1
“Four tong one da” – Shentong Express, Yuantong Express, Zhongtong Express, Best Express (Chinese name contains tong) and Yunda Express are a group of second tier express delivery firms with a focus on e-commerce orders. They are similar in scale and strategy and each operator employs 50-200k workers with 7-15k service centres.
JD.com logistics assets: (as of Dec 2015)
Fulfillment centers: 7
Nationwide coverage: 31 provinces, 2,356 counties and districts
Delivery / pickup stations: 5,367
Next-day delivery as % of direct-sales: 85%+
Over-the-road vehicles: 58,000
Warehouse GFA: 4mm sqm
Warehouse staff: 15,765
Delivery Staff: 59118
Total Warehouse and Delivery personnel: 74,883
- JD Home/JD Daojia
“In the past, we changed the way our customers shop; in the future, we want to change the way our customers live.”
– Richard Liu, JD.com Founder & CEO
Brief Notes on JD Daojia:
-Daojia is a location-based services (LBS) enabled O2O app which provides local services including supermarket, food delivery, flower delivery, laundry and home cleaning services and uses crowd-sourced delivery network
-Daojia serves 12 cities, and its GMV is less than 1% of JD’s total GMV
-This is a high frequency volume generating business, which create cross selling -opportunities as well as provides JD an opportunity to strengthen its big data capabilities
-Valuation proposition for merchants is to help them increase sales via O2O channel
-company will have a revenue sharing model with supermarkets in the future
-JD announced partnership with Yonghui Superstores and have subscribed for ~10% of Yonghui’s shares for Rmb4.3bn
-they also have a small stake in ele.me, a food delivery service
-JD Daojia does not own the products or services provided by 3P merchants, and only handles the fulfilment portion of the service
-JD is currently building its own cold chain supply network
-premium/high-end groceries are sold and fulfilled by 1P/cold chain logistics (similar to Amazon Fresh)
-Google Express is a similar O2O service that partners with large B&M such as Walmart, Target and Costco
-The average Chinese city is quite dense with heavy traffic; for eg. Shanghai has a population of over 20 million, which is greater than the entire population of greater New York
-Dada specializes in last-three-kilometer delivery
- Key Operating Drivers and Unit Economics
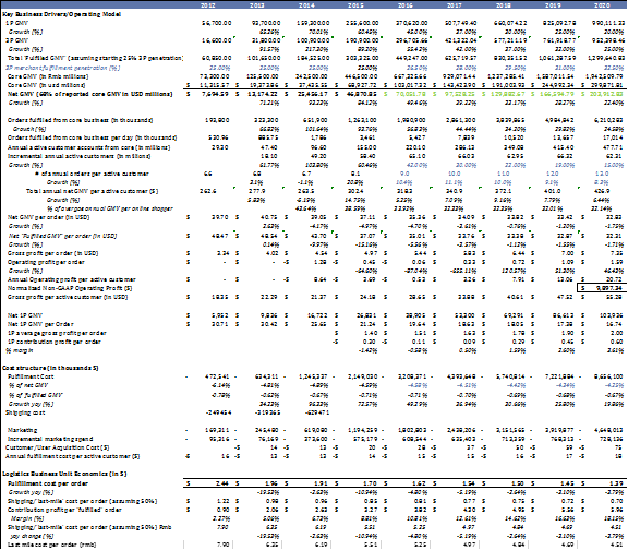
- Long-term Financial Model
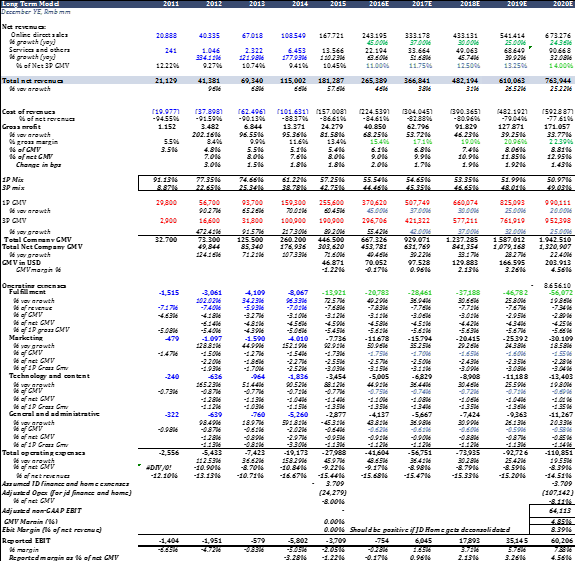
- Top-down Projections
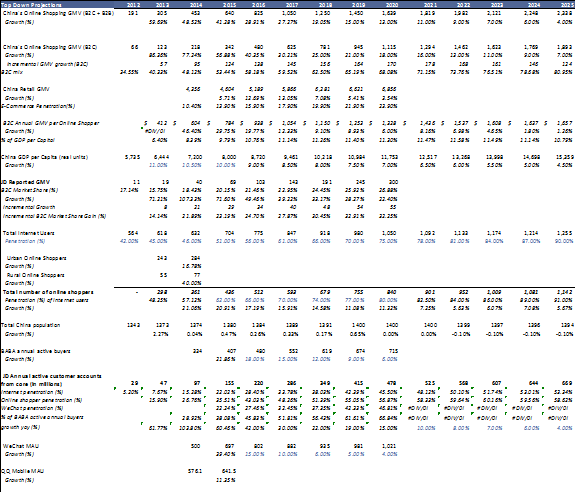
- Working Capital Schedule
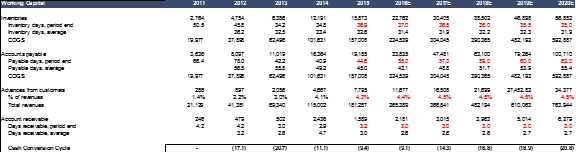
In the production of this paper I’ve taken either quotes, information, or insights from the following books:
- Kissinger: On China
- The End of Copy Cat China: The Rise of Creativity, Innovation, and Individualism in Asia
- China’s Super Consumers: What 1 Billion Customers want and how to sell it to them
- China’s Disruptors: How Alibaba, Xiaomi, Tencent, and Other Companies are Changing the Rules of Business
- Changing how the world does Business: FedEx’s incredible journey to success
- Leadership Lessons from a UPS Driver
- Alibaba: The House that Jack Ma Built
- Sam Walton: Made in America
- East-Commerce, A Journey Through China E-commerce and the Internet of Things: A Journey Through China E-commerce and the Internet of Things
- The Founding of JD.COM (Liu Qiangdong’s Entrepreneurial Journey)
[1] A term coined by Jim Collins, think of Amazon as an example
[2] Net GMV is reported/gross GMV net of returns, order cancellations and VAT related charges
[3] General merchandise items such as apparel, baby, cosmetics and home products likely exhibit gross margins closer to the mid-teens range, or at least 2-3x electronics GM
[4] Suppliers/wholesalers tend to purchase branded display ads, whereas third-party merchants tend to purchase performance-based ads; advertising revenues are roughly split 50/50 between merchants and manufacturers/wholesalers/re-sellers
[5] JD Finance also provides online payments services to customers outside JD’s platforms
[6] Average inventory days is for the core e-commerce business, which includes any effects from JD Finance
[7] To ensure product authenticity, stringent background checks are conducted on each 3rd party merchant or supplier which includes, qualification certificates for products, examining business license and on-site visits
[8] Packages delivered by low-tier third-party logistics firms are generally at greater risk of being damaged or late
[9] According to a recent customer survey conducted by RedTech Advisors, approximately half of Chinese online shoppers have experienced purchasing a fake product
[10] JD started investing in its logistics network in 2007 after Richard Liu learned that 70% of JD’s customers were dissatisfied with subpar quality delivery services from third party logistics firms.
[11] Alibaba has decided to outsource last-mile delivery to third-party logistics firms via their JV Cainiao
[12] JD as an online shopping platform has built substantial consumer mindshare as a trusted site that sells authentic products
[13] RedTech Advisors, a reputable research firm, conducted surveys to weigh the importance of price, product authenticity, delivery service quality and selection in online shopper’s minds
[14] Morgan Stanley also recently conducted a global survey of over 10,000 online shoppers indicating that free shipping is the biggest attraction to shopping online. According to a global survey by PayPal, Chinese online shoppers are among some of the most demanding in terms of delivery time, averaging a “delivery tolerance period” of about 5.5 days
[15] According to a recent survey conducted by research firm RedTech Advisors, Taobao was the source of nearly 80% of fake products purchased by online shoppers, and the source of 73% of products which were returned
[16] RedTech Advisors recently conducted a survey of Chinese online shoppers showing that Tmall was the source of 19% of fake products
[17] I am aware Alibaba has other businesses outside of e-commerce such as cloud computing services and internet finance
[18] Buffet as stated that “Leaving the question of price aside, the best business to own is one that over an extended period can employ large amounts of incremental capital at very high rates of return.”
– 1992 Berkshire Hathaway Annual Shareholder Letter
[19] For example, the top 20 B&M retailers in China have a 12% share vs 40% for the US
[20] In fact, e-commerce penetration levels are already higher in China than the US
[21] Suning and GOME have been closing down stores and pushing aggressively into online sales channels
[22] This has allowed TJX to scale a repeatable business model over higher volumes and achieve significant cost efficiencies over time
[23] Richard Liu tweeted on Weibo in late 2012, translated: “Tonight, once again I made the decision to sell big home appliances at 360buy at zero gross margins for the next three years… Within these three years, any employee found to sell at marked-up prices will be fired… I assure you that the prices of large home appliances sold on Jingdong will be at least 10 percent lower than those in the Gome and Suning stores… Starting 9 am tomorrow morning, all big home appliances at 360buy will be sold at cheaper prices than those from Suning, both online and offline. There will be no bottom line. If Suning dares to sell at 1 yuan, then 360buy will surely sell at 0 yuan. To those who plan to buy big home appliances, you will lose money if you don’t follow 360buy.”
– Richard Liu, JD.com Founder & CEO
[24] JD has a “100-minute policy”: If a customer has any complaints about a product, a delivery person will be back at his doorstep within an hour and 40 minutes after the complaint is lodged.
[25] JD can also hold a greater number of SKUs, and have faster inventory turns than offline competitors; this contributes to JD’s lower cost structure
[26] JD started off primarily selling electronics items online, and now as a more mature category it is growing at a slower rate. Coming off a lower base, home appliances and general merchandise categories have higher growth potential and were introduced to the platform several years after electronics around 2010.
[27] Products with less seasonality and inventory risks such as socks, for example, are sold on the 1P platform and non-standardized, long-tail products[27] are typically sold on the third-party marketplace.
[28] This long-term direct-sales gross margin estimate is in-line with JD CFO’s recent comments; he expects JD’s long-term direct sales gross margins to be in the mid-range between its current levels and the average of offline retailers (~19%).
[29] It is not difficult to add an incremental product category to your platform once you have built a sticky customer base
[30] Under Rmb99 per order, delivery fee appears to be Rmb5
[31] Source: Siilu.com, February 12, 2015
[32] In the past, JD’s 1P business priced its products lower than offline competitors and Alibaba’s platforms but this spread has narrowed as price is no longer the most important purchase criteria for shoppers; convenience is now the most important factor.
[33] Third-party marketplace services such as fulfillment (warehousing) and delivery are currently priced around marginal cost in order to drive higher volumes.
[34] If the merchant’s business volume is very small, they may only have fulfillment/warehouses in certain regions, meaning that for fulfillment/delivery JD will have to pick-up a smaller number of SKUs from that merchant, and potentially deliver it cross-region to another regional sortation center, closer to where the final destination is; this adds too many layers of distribution and costs that make the third-party fulfillment business unprofitable for lower volume merchants
[35] CLSA estimates that Amazon earns a 10% contribution margin for its fulfillment services
[36] This long-term gross margin estimate is in-line with JD CFO’s recent comments; he thinks JD’s overall gross margins could eventually improve to 20%
[37] Payment processing fees and customer service center costs are also included in JD’s fulfillment expense line item
[38] According to AT Kearney, and also confirmed by JD’s current fulfilment cost structure
[39] CLSA estimated that the average fulfillment cost per order for large B2C platforms with 1P businesses are typically Rmb20-22 (US$3.2-3.5).
[40] According to CLSA, JD’s average delivery cost is Rmb5.2 (~$0.8) per order in tier-1 cities such as Beijing and Shanghai. For cities with at least 2k+ orders per day, JD’s cost per order would be on par with 3P courier firms.
[41] This expense pool also includes all of JD’s customer service related costs, such as call centers and employees, which is a service not provided by third-party couriers
[42] I estimate the contribution profit margin to be MSD margin as a % of Net 1P GMV per order
[43] For every 8 complaints of online shoppers, one is related to delivery. Labour productivity, in particular, is very low as the average number of parcels delivered by express delivery personnel was 23 per day in 2014 vs >50 in the US.
[44] Some of the delivery franchisees in lower tier cities offer promotions as low as Rmb2-3 per delivery; JD believes these local franchisees either make no profit or incur losses
[45] Based on my knowledge, every Chinese e-commerce firm outsources this part of the value chain. In some remote Western Chinese regions, some logistics processes are outsourced.
[46] Given JD’s growing direct-sales volume and GFA to hold more SKUs, cross-regional line-haul is becoming less common
[47] 30% of JD’s annual active customers still prefer COD services
[48] Pay-for-performance is also used to incentivize delivery staff to meet daily targets.
[49] Local governments rather approve land for non-logistical purposes in order to generate more tax revenues
[50] Alibaba has a modus operandi that adheres to an asset-light approach
[51] Most traditional warehouses (~6k sqm) in China do not meet modern logistics requirements in terms of location, height, spacing, lighting, vehicle accessibility, loading docks and safety standards. Modern warehouses typically have wider column spacing, higher floor to ceiling, larger floor plates and truck docking bays compared to traditional warehouses.
[52] Warehouse personnel can account for nearly 50% of the fulfilment cost of storing inventory. JD’s new Asia 1. FC can sort up to 16K packages per hour
[53] JD has already acquired land use rights to over 3mm sqm in 12 cities
[54] The typical all-in cost for a warehouse in China is Rmb5,000 per sqm in tier 1 cities and Rmb3,000 per sqm in tier 2 cities
[55] Fulfillment costs make up around half of JD’s total cost structure
[56] JD’s inventory days is relatively low at 32 – 33 and they have sufficient transaction to appraise the value of this inventory, helping reduce inventory risk
[57] Rates for merchant financing may be closer to 15%
[58] People’s Bank of China
[59] Alibaba recently launched MYbank, and Tencent has WeBank, which are essentially online banks.
[60] For detailed JD Finance modelling assumptions, please contact the Author directly
[61] 30% of JD’s customers still prefer CoD services
[62] A similar phenomenon occurred between the relationship of PayPal and eBay, for example, when PayPal clearly should be its own independent company. Ant Financial will also likely be fully spun-out of IPO’d out of the Alibaba holding structure
[63] The company can tap the ABS market for more wholesale funding with third party financial institutions. In fact, JD Finance recently offered a 4.7 – 6.9% rate during a Rmb2bn securitization round in Q42015.
[64] JD Finance has an advantage in an attractive customer acquisition cost via online distribution if it needs to build a large customer deposit base
[65] Not counting any cash accumulated on the balance sheet.
[66] Richard Liu said in an interview: “… two other investment groups from Shanghai and Hong Kong travelled to Suqian to propose investing in the company, both at prices that were a third higher than Tiger had offered. Both my CFO and executive assistant were sitting in my office, watching over how I planned on handling the situation. I asked them what ranks first on our company’s set of values? Easy, integrity! If integrity is what we believe in, then we don’t even have to spend time thinking about this. Not just for a 30% premium, even if they had offered 300% higher, we would never entertain their proposal. So overnight we lost over 100 million RMB (in dilution – worth billions at today’s stock price), but I don’t regret that decision once.”
[67] Liu said in an interview with the WSJ during JD’s IPO that he would not rest until JD was the most profitable company in China
[68] DangDang, pitched as the “Amazon of China”, has largely failed to meaningfully expand its category mix outside of books
[69] B2C + C2C
[70] Offline + online
[71] CLSA and iResearch, two the most well-respected Asia/China focused research firms are assuming total China B2C market growth of just under 30% per annum over the next several years.
[72] For reference, currently BABA has 50 orders per active customer per annum vs. 8 for JD
[73] In a nutshell, Tencent sold its e-commerce properties to JD, provided level-1 access to Tencent’s online communications/social media properties to JD’s mobile app, and entered an 8-year non-compete agreement with JD. In exchange, Tencent received a ~20% equity stake in JD.
[74] WeChat and QQ users will have Level 1 access to JD’s mobile shopping app; Level 1 access means there will be a link to JD’s app on the app’s homepage so that WeChat or QQ users don’t have to leave the app or directly go on JD’s website or mobile app to shop.
[75] Some would say addictive
[76] Hailing a cab, buying movie tickets, and paying utility bills, for example, are some activities you can perform on WeChat in China
[77] Users can access daily services on WeChat, and make a payment on the app in a closed-loop transaction.
[78] I model JD’s customer penetration of WeChat to be around 46% by 2020
[79] According to Alibaba’s COO, internet penetration is ~60% in urban cities but only 27% in rural villages. “The future of e-commerce in China is smaller cities” – Richard Liu, JD.com Founder & CEO.
Note that I already model lower a GMV per order based on outsized growth from lower-income, rural-based customers. The net effect to GMV per annual active customer, however, remains positive over time, as purchasing frequency increases.
[80] Acquisition-related amortization of intangibles is added back to non-GAAP EBIT and PE. SBC is fully-expensed. Maintenance FCF assumes 0 capitalizing FCF at a non-growth state, so no cash flow generated from working capital is capitalized; Full CapEx is also assumed
[81] Note that all the USD/Rmb fx rates used in this report are based on 6.4778 rate.
[82] I estimate Net GMV will be 68% of reported/gross GMV
[83] Cash conversion cycle was around (10) days in 2015, which I expect to further decrease to (20) days in 2020
[84] This implies a 4% terminal growth rate and 8% cost of capital
[85] In reality this figure is actually much higher if we subtract the excess cash on the balance sheet
[86] 6% growth into perpetuity with a 8% cost of capital
[87] Uber is a business with a similar business model (local economies of scale, reliant on order density, benefits from network effect, disruptive to traditional large industry, large TAM, etc.)
[88] Amazon is a prime example, pun intended